Dashboard
WASH Monthly Report Card
The WASH Monthly Report Card is a predefined dashboard that provides key indicators related to water, sanitation, and hygiene services. This section will walk you through the different indicators, graphs, and filters available on the dashboard.
Accessing the dashboard
What : Access The WASH Monthly Report Card
Who : All users, including anonymous users, can access the dashboard.
How :
- Go to https://tims.unhcr.org/ in your web browser.
- If you are a registered user, sign in with your username and password as usual. For anonymous users, you can directly access the Dashboard Page without signing in.
- You'll be taken to the Home page after login.
-
Open the Dashboard page
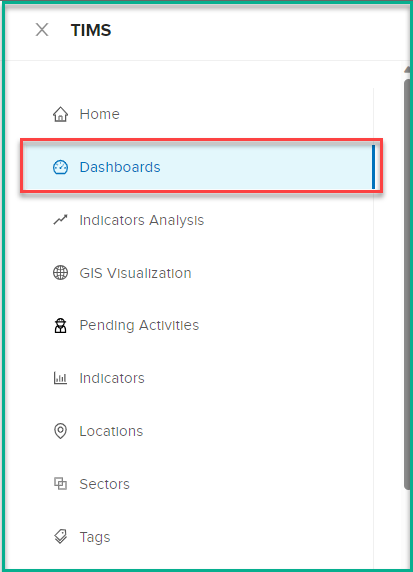
-
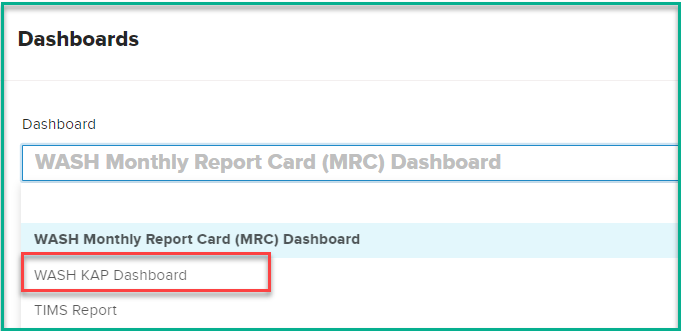
Click on the dashboard dropdown list then select 'WASH Monthly Report Card' option
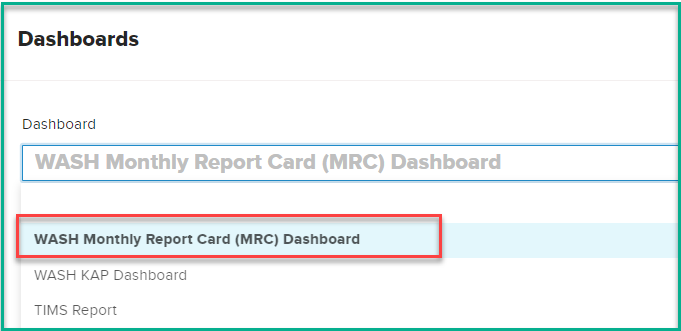
-
After selecting 'WASH Monthly Report Card' , the system will initiate the data loading process, which may take a few minutes to complete, depending on the data volume.
- Once the data is fully loaded, the dashboard will display the MRC-specific indicators and data for analysis.
Dashboard Filters
The dashboard provides several pre-defined filters to help users focus on specific data subsets.
What : The dashboard provides two main options for filtering the data to customize the analysis according to specific requirements.
How :
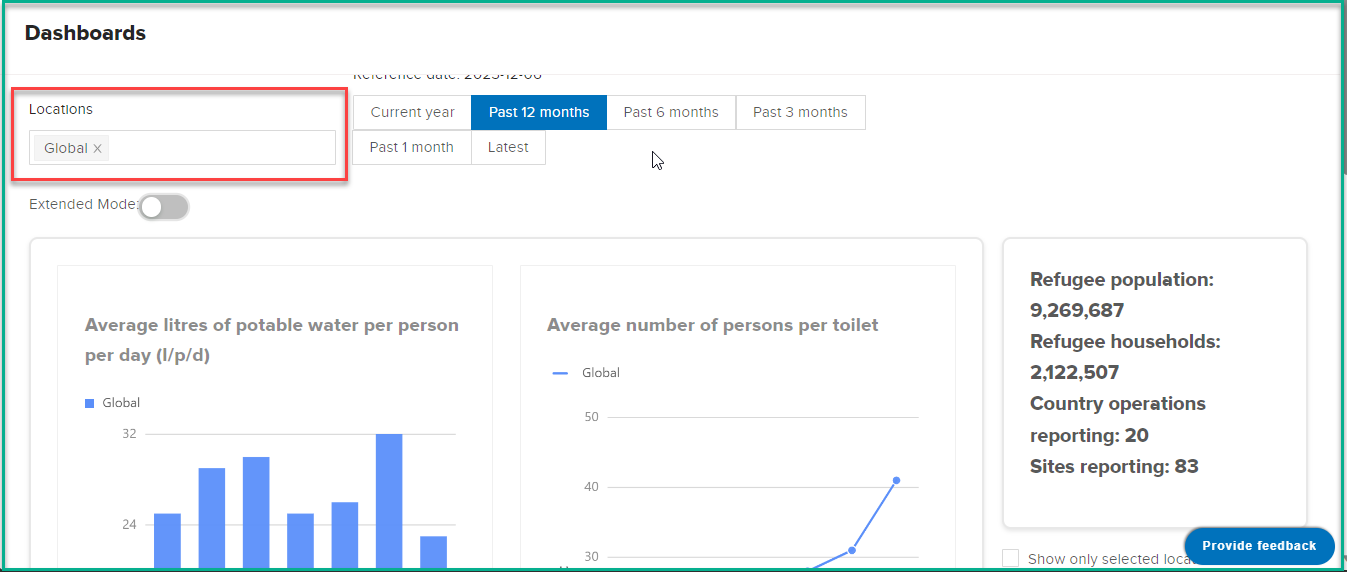
- Selecting Locations: Users can use the first filter option to choose specific locations they want to analyze. The dashboard offers a dropdown list containing available locations, such as sites,countries, and regions. Users can select one or multiple locations from this list to focus the data on the chosen area(s).
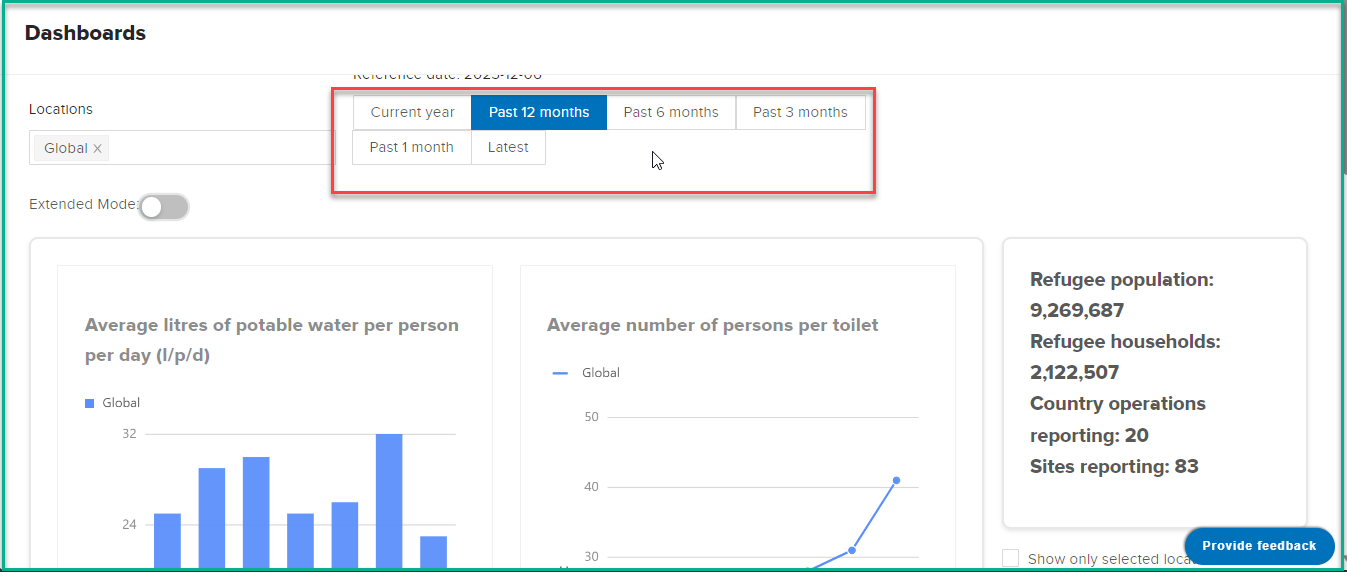
- Selecting Date: The second filter option allows users to define the time range for their analysis. The dashboard offers several pre-defined date ranges: Current Year, Past 12 months, Past 6 months, Past 3 months, and Past 1 month.
Dashboard Visualization
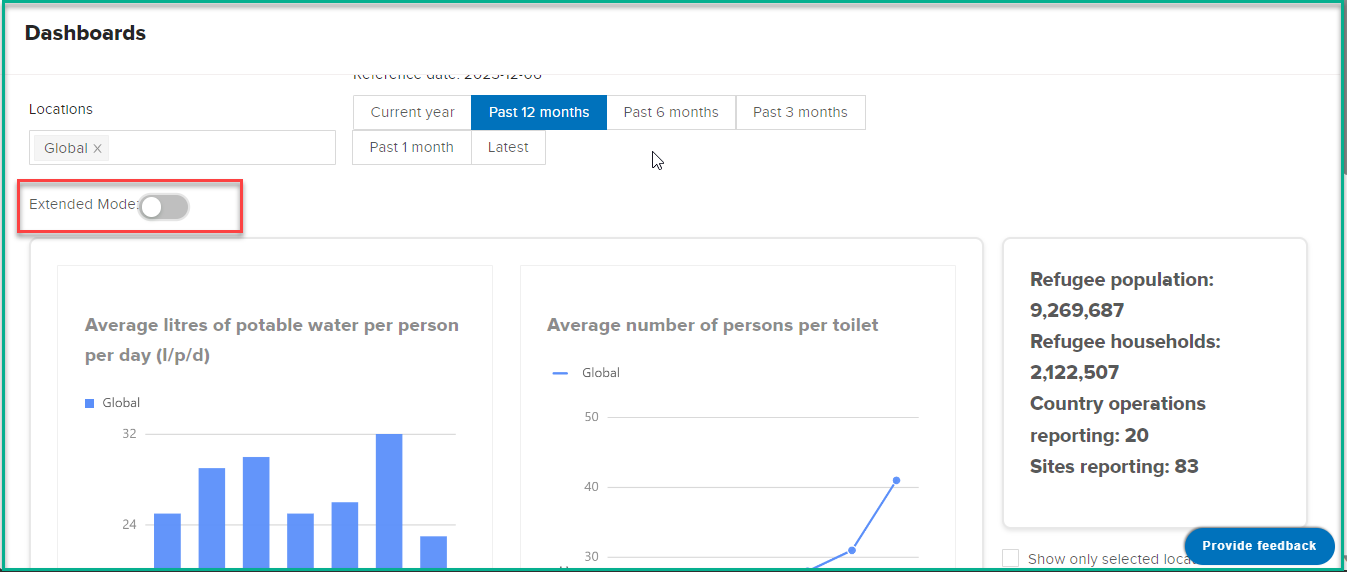
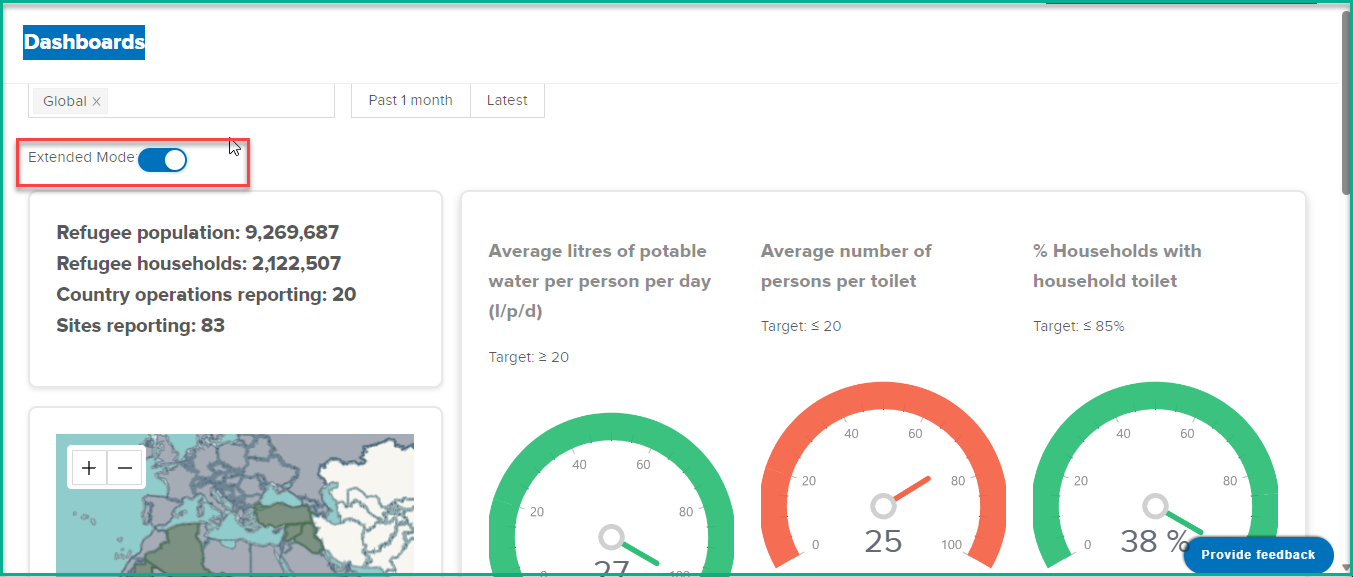
The dashboard provides two main modes of presentation, which can be controlled by the "Extended" toggle option. The mode selection determines the level of information displayed on the dashboard
Basic Visualization
In this mode, the dashboard shows essential indicators and data for the selected locations and date range. It offers a concise overview of key metrics without overwhelming users with too much information.
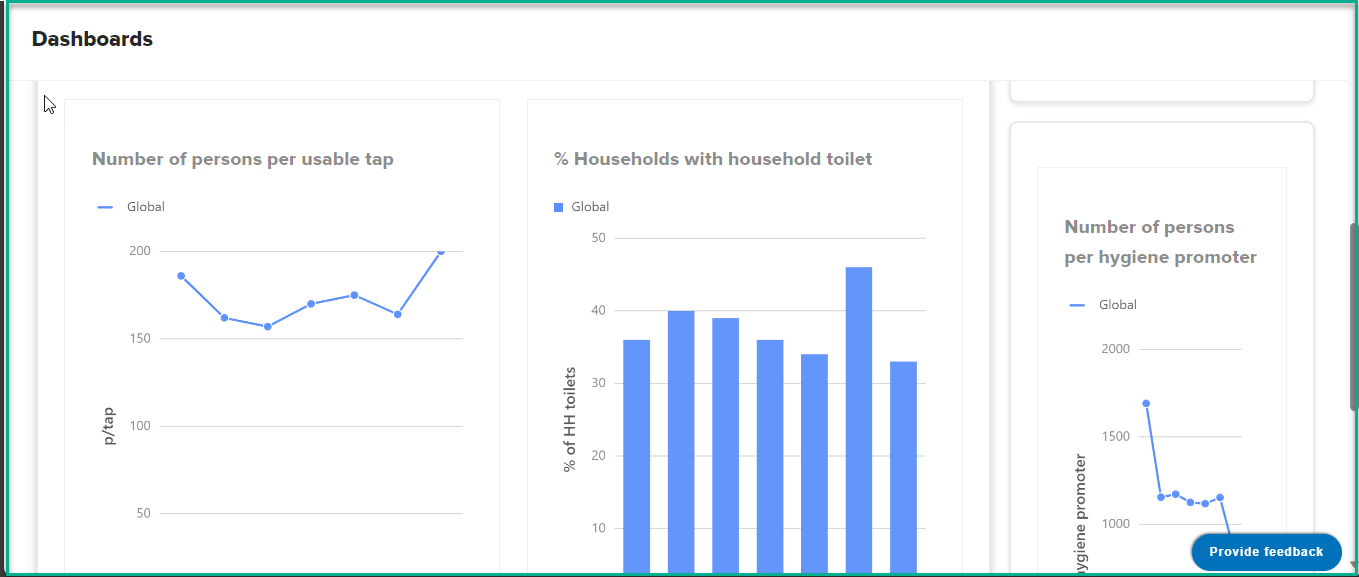
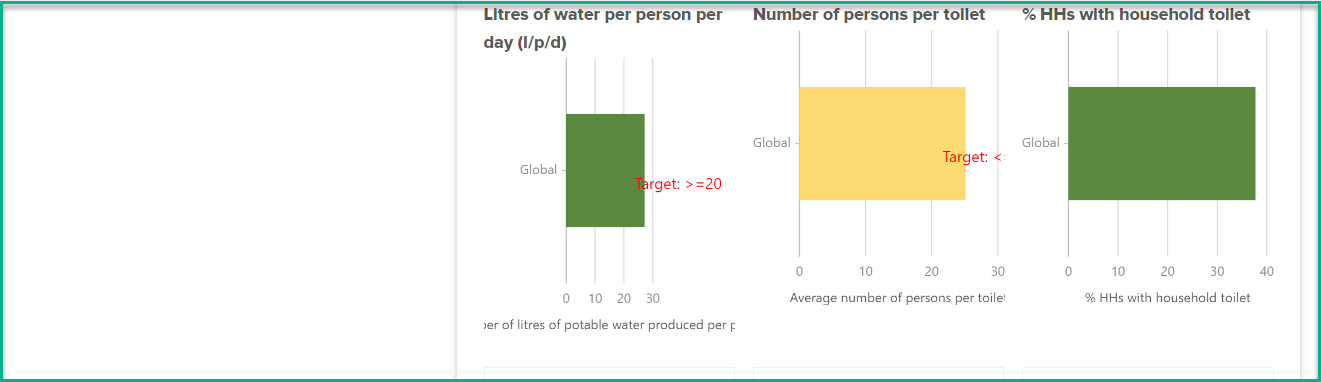
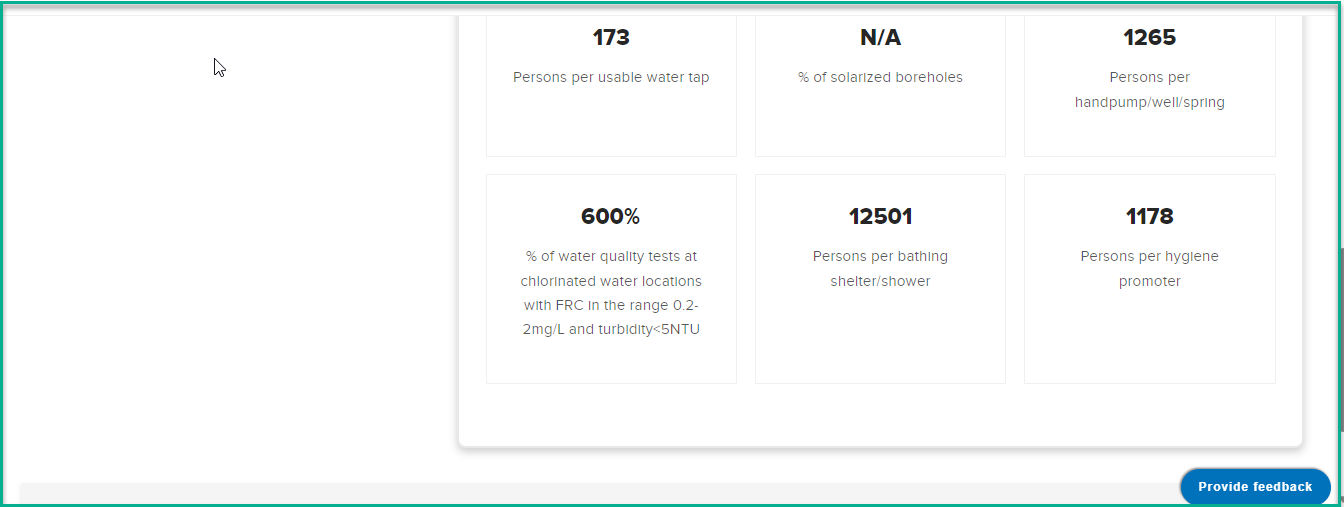
Extended Visualization
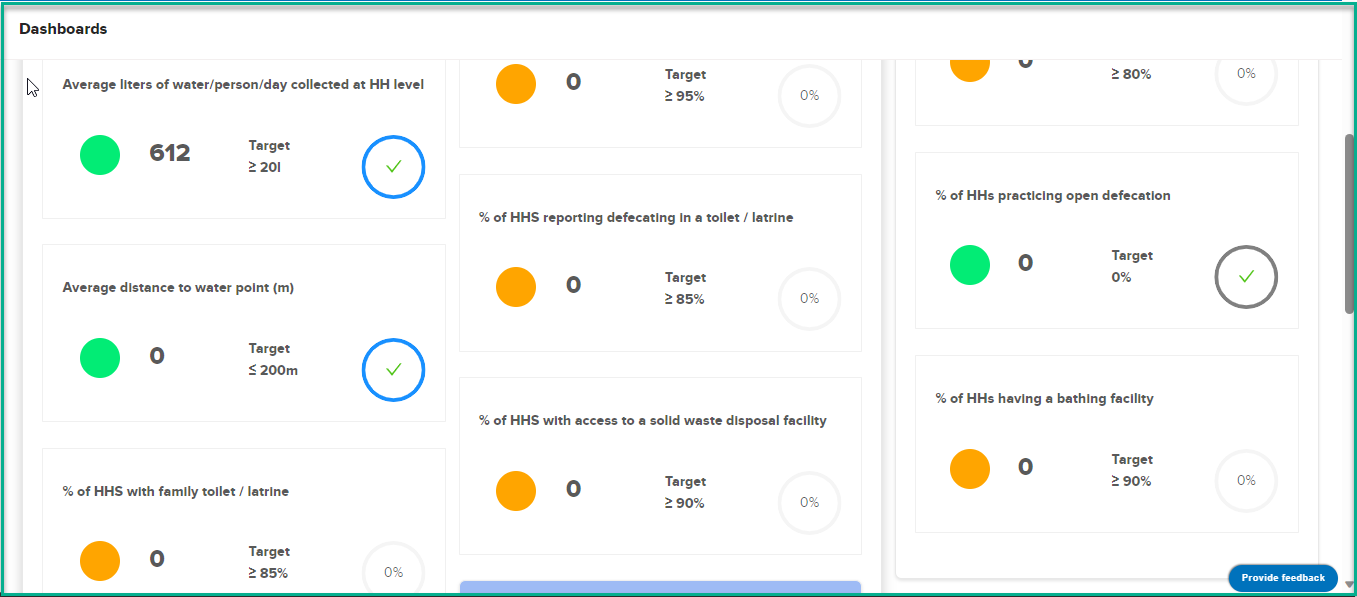
When the "Extended" toggle is checked, the dashboard expands to provide a more comprehensive view of data. It includes additional indicators and offers an in-depth analysis for users requiring more detailed insights.
WASH KAP Dashboard
The WASH KAP Dashboard is a predefined dashboard that provides key indicators related to water, sanitation, and hygiene services. This section will walk you through the different indicators, graphs, and filters available on the dashboard.
Accessing the dashboard
What : Access The WASH KAP Dashboard
Who : All users, including anonymous users, can access the dashboard.
How :
- Go to https://tims.unhcr.org/ in your web browser.
- If you are a registered user, sign in with your username and password as usual. For anonymous users, you can directly access the Dashboard Page without signing in.
- You'll be taken to the Home page after login.
-
Open the Dashboard page
-
Click on the dashboard dropdown list then select 'WASH KAP Dashboard' option
-
After selecting 'WASH KAP Dashboard' , the system will initiate the data loading process, which may take a few minutes to complete, depending on the data volume.
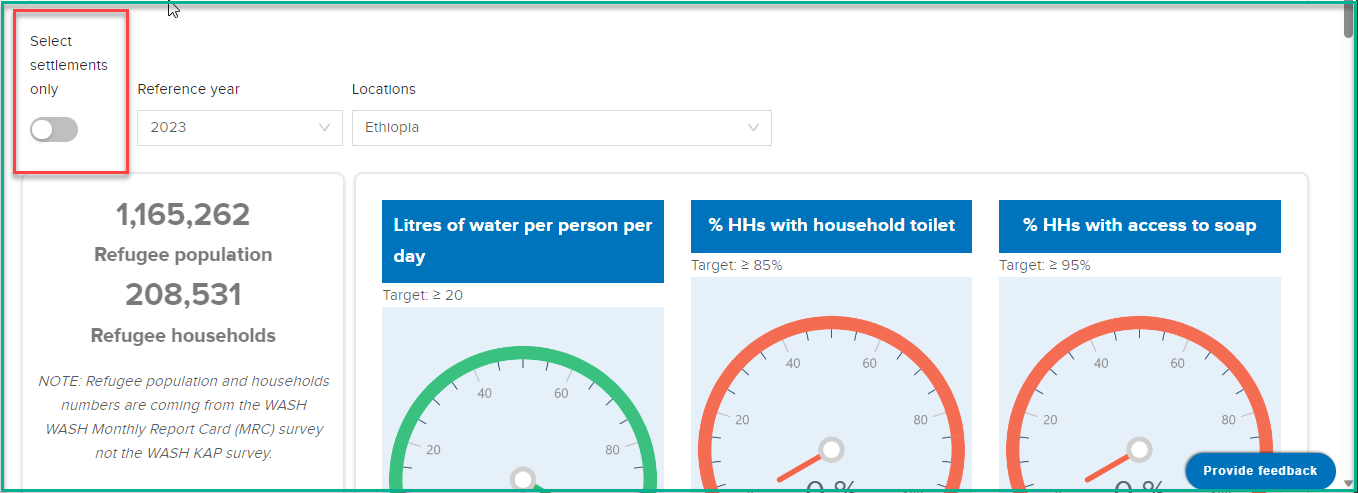
Dashboard Filters
The dashboard provides several pre-defined filters to help users focus on specific data subsets.
What : The dashboard provides two main options for filtering the data to customize the analysis according to specific requirements.
How :
- Selecting Settlements: Users can use the first filter option to choose specific locations they want to analyze.
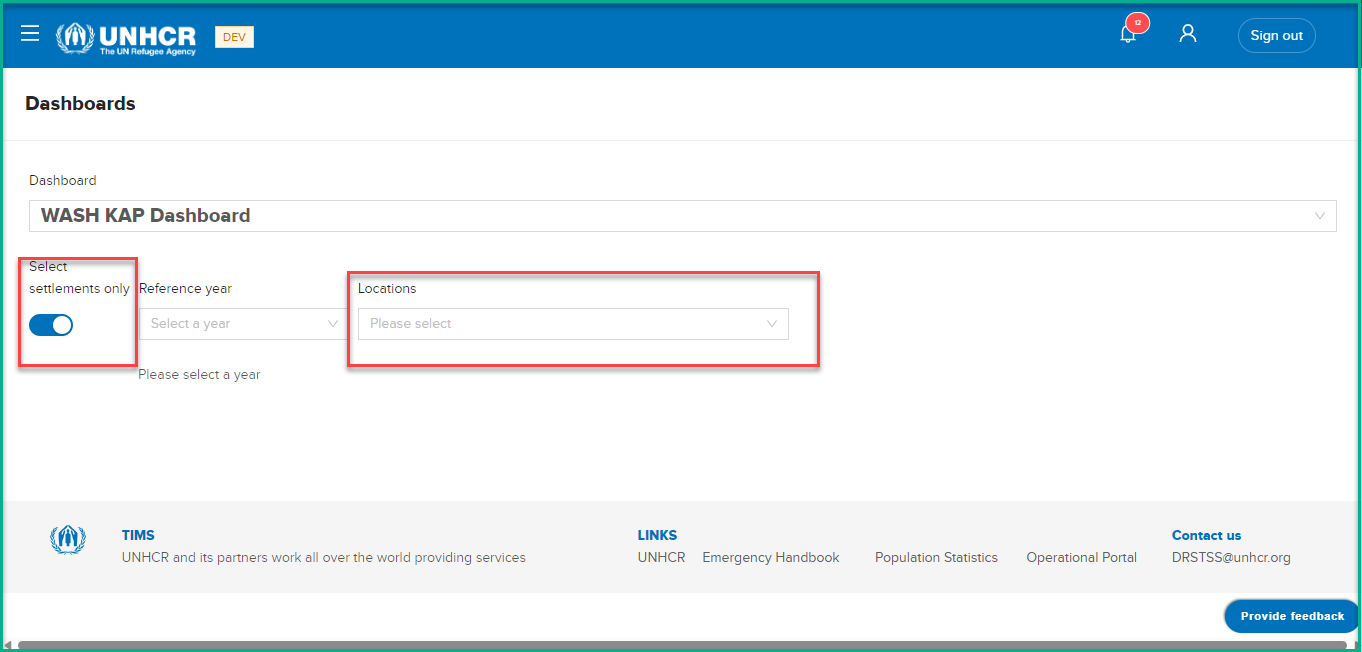
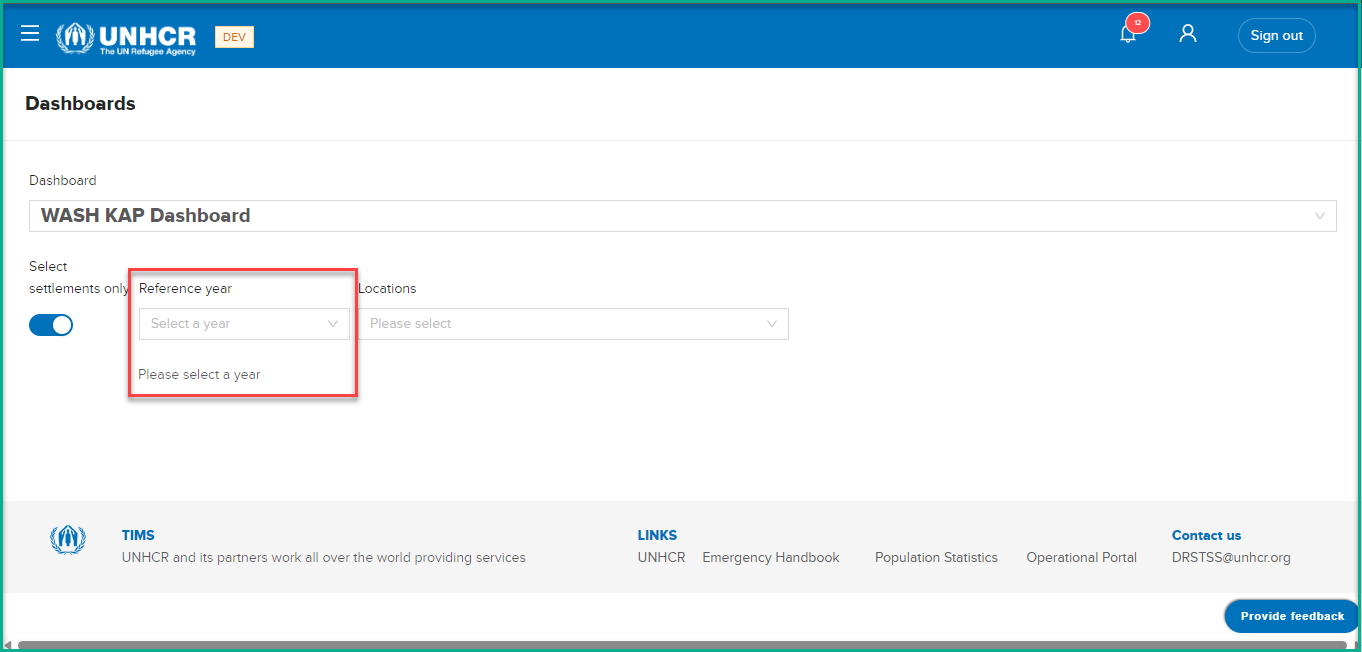
- Selecting Year: The second filter option allows users to define the year for their analysis.
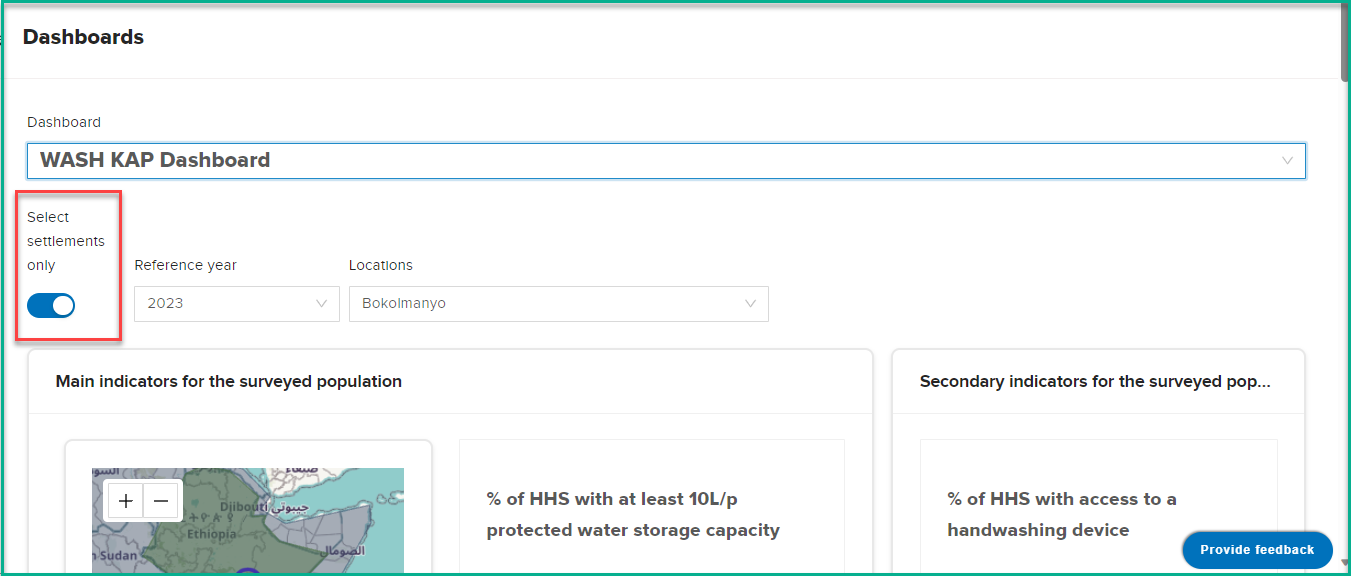
Dashboard Visualization
The dashboard provides two main modes of presentation, which can be controlled by the "settlements" toggle option. The mode selection determines the level of information displayed on the dashboard
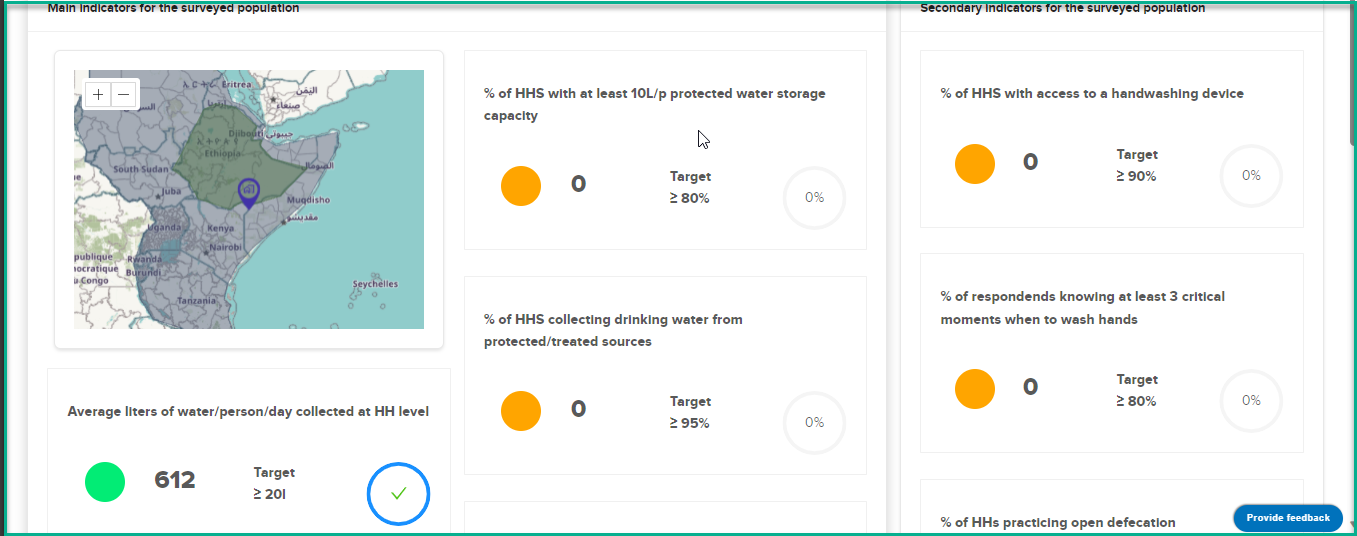
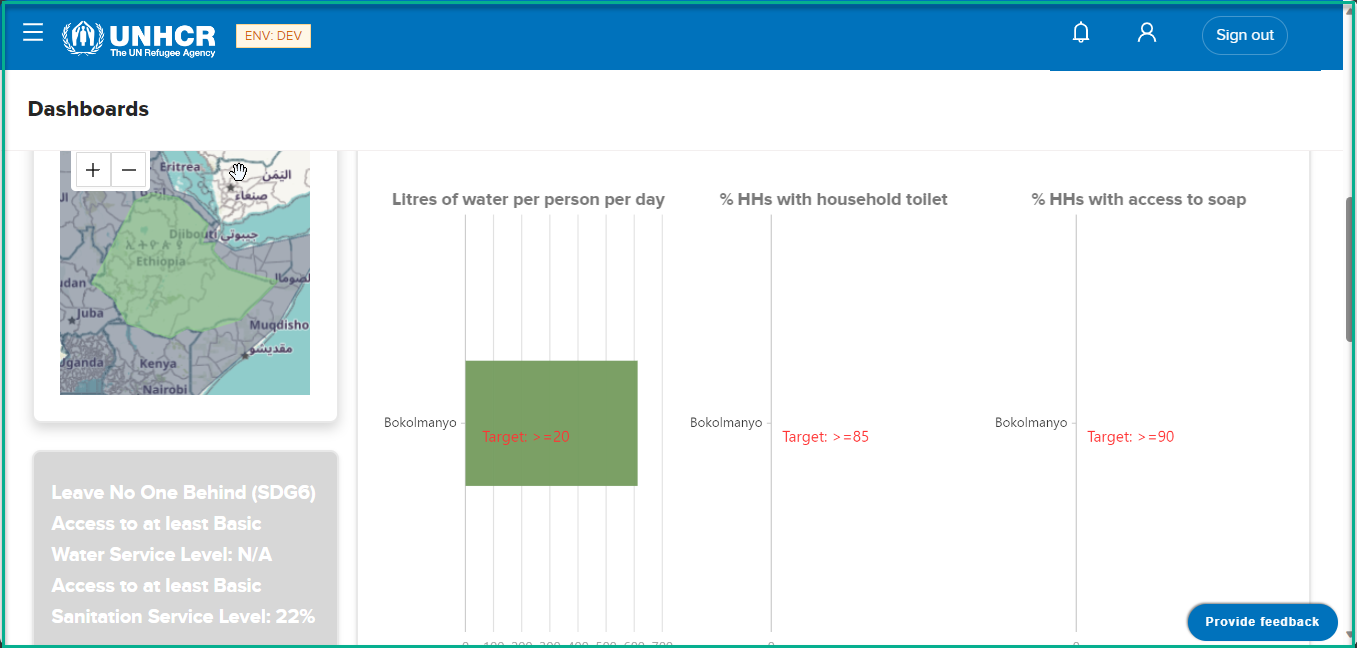
Settlements Visualization
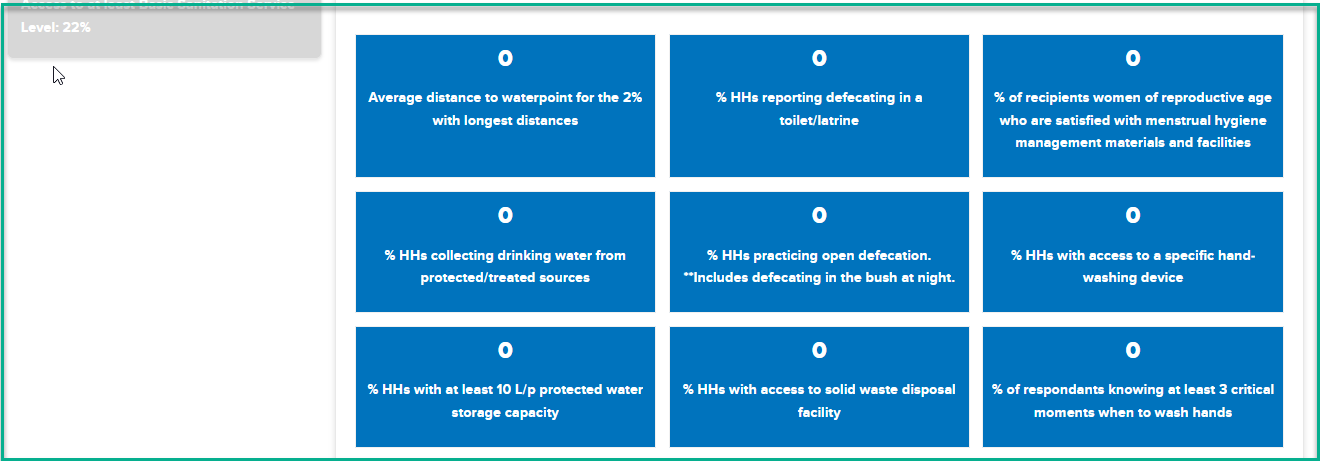
In this mode, the dashboard shows essential indicators and data for the selected site .
Region/Country Visualization
In this mode, the dashboard shows essential indicators and data for the selected Location .
SSAT Settlement Dashboard
The SSAT Settlement Dashboard is a predefined dashboard that provides key indicators related to settlement . This section will walk you through the different indicators, graphs, and filters available on the dashboard.
Accessing the dashboard
What : Access The SSAT Settlement Dashboard
Who : All users, including anonymous users, can access the dashboard.
How :
- Go to https://tims.unhcr.org/ in your web browser.
- If you are a registered user, sign in with your username and password as usual. For anonymous users, you can directly access the Dashboard Page without signing in.
- You'll be taken to the Home page after login.
-
Open the Dashboard page
-
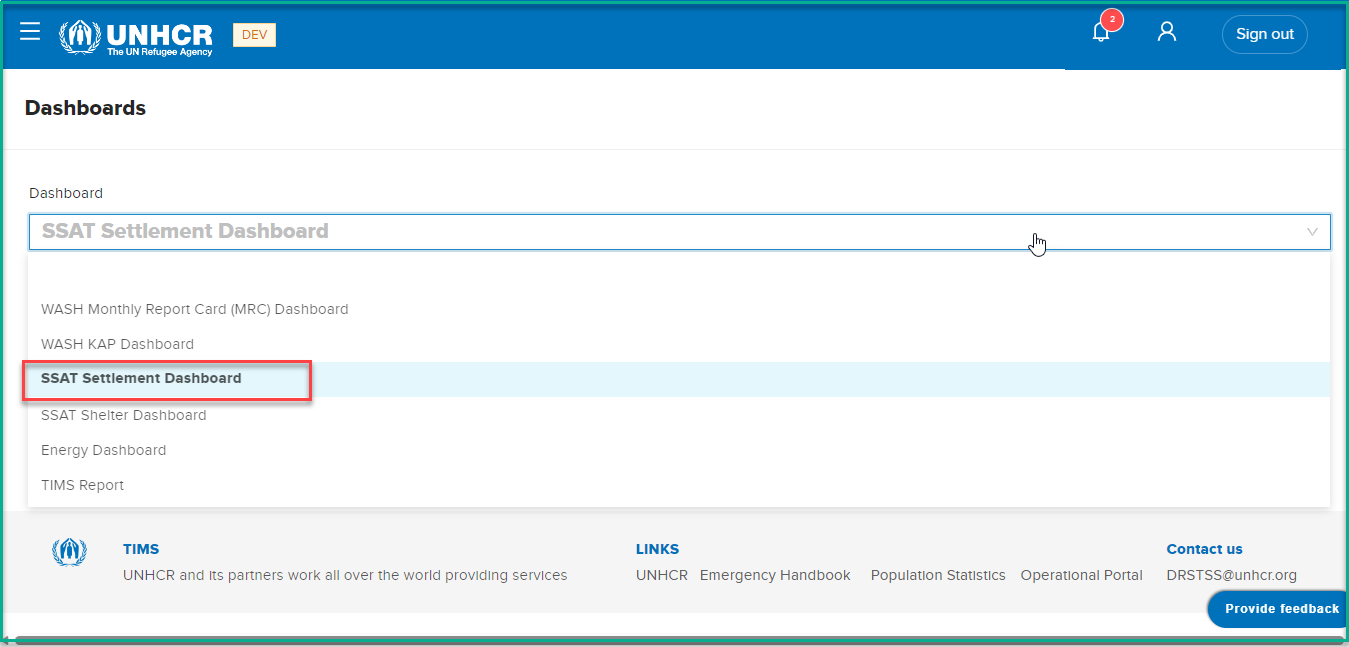
Click on the dashboard dropdown list then select 'SSAT Settlement Dashboard' option
-
After selecting 'SSAT Settlement Dashboard' , the system will initiate the data loading process, which may take a few minutes to complete, depending on the data volume.
Dashboard Filters
The dashboard provides several pre-defined filters to help users focus on specific data subsets.
What : The dashboard provides two main options for filtering the data to customize the analysis according to specific requirements.
How :
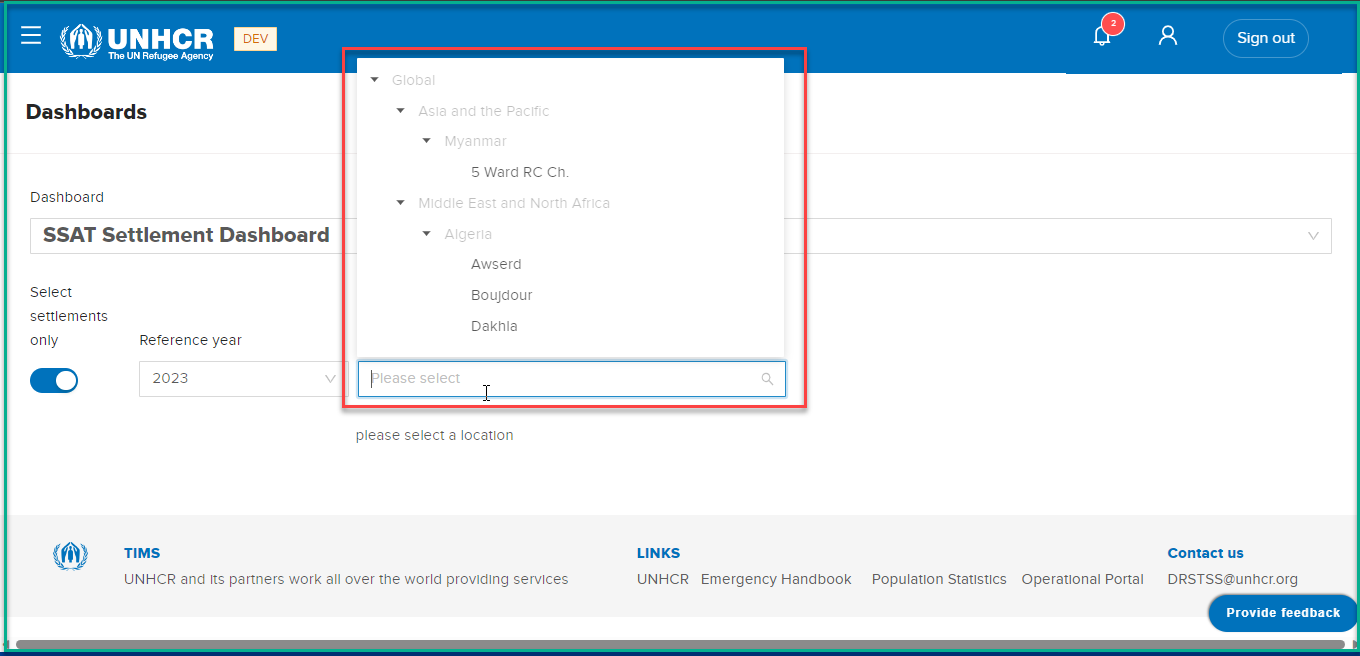
- Selecting Settlements: Users can use the first filter option to choose specific locations they want to analyze.
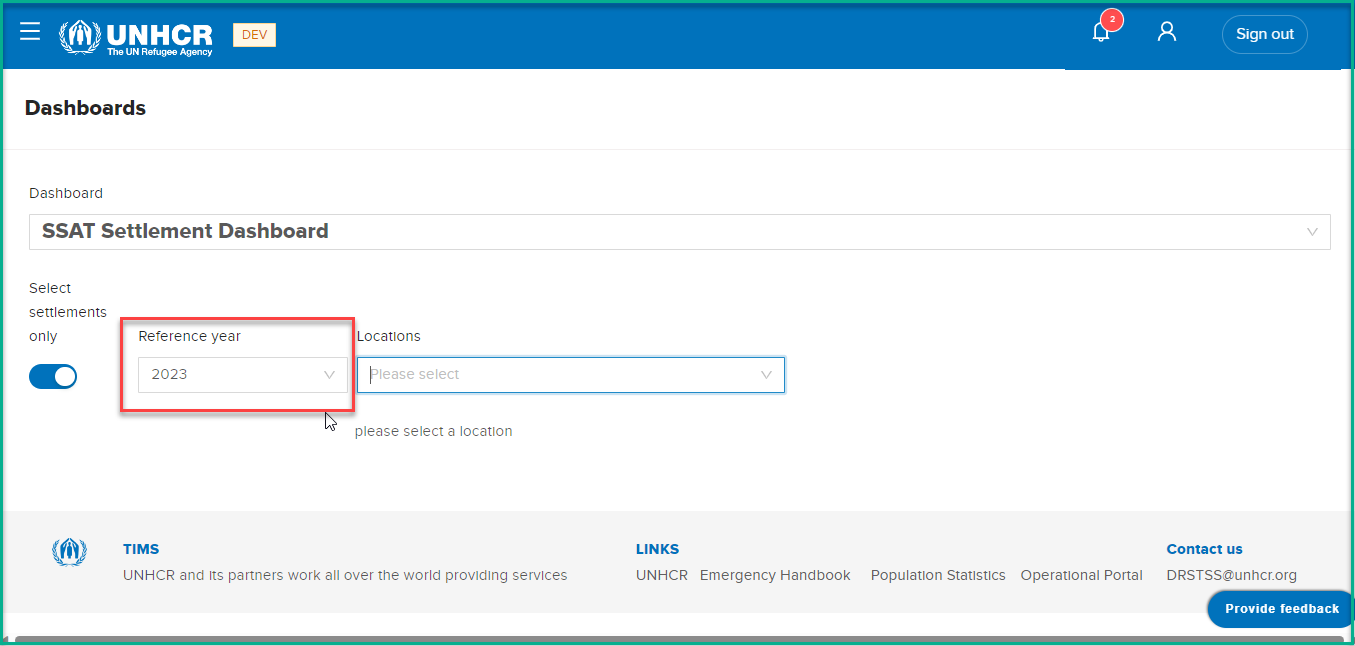
- Selecting Year: The second filter option allows users to define the year for their analysis.
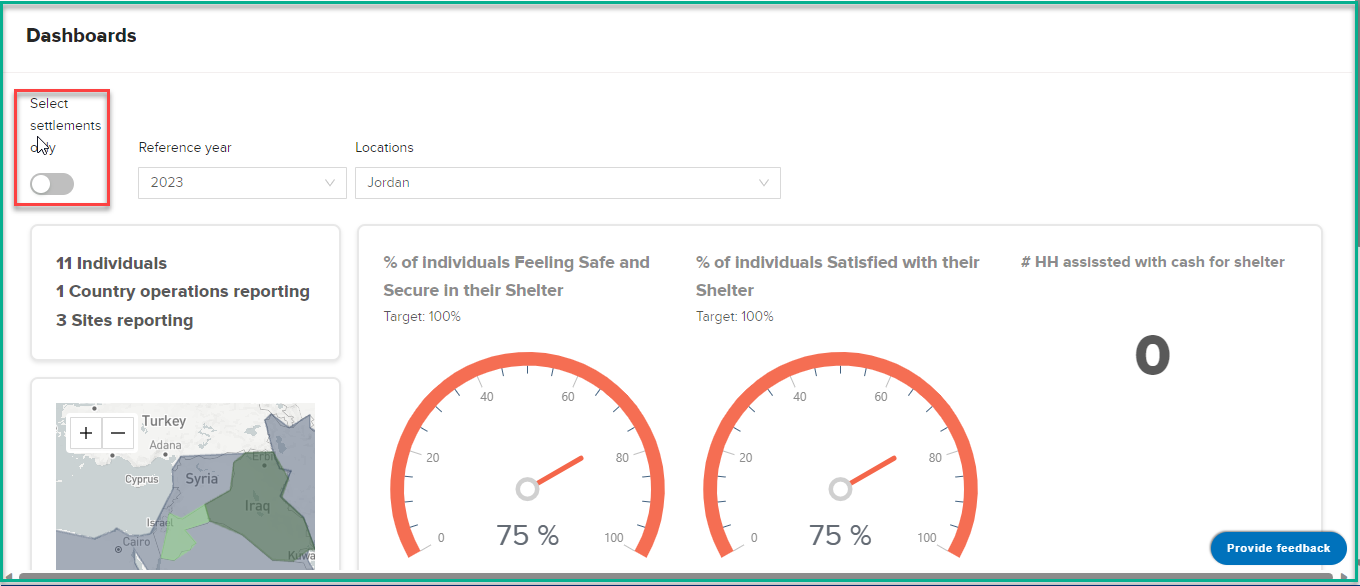
Dashboard Visualization
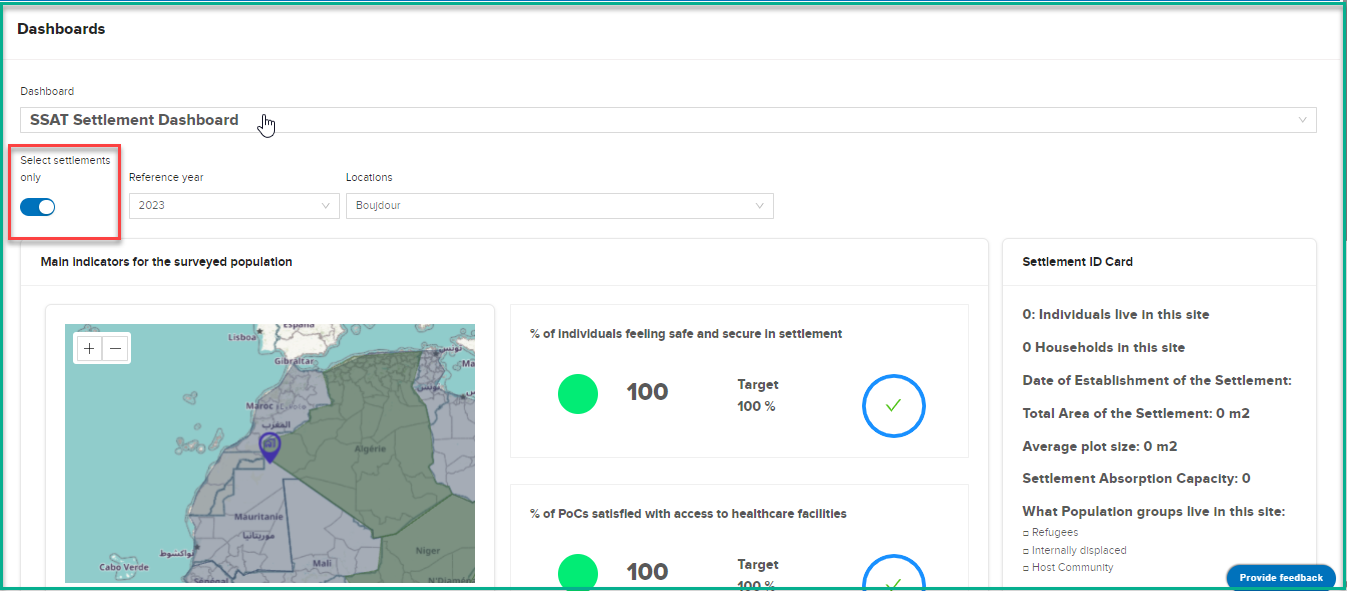
The dashboard provides two main modes of presentation, which can be controlled by the "settlements" toggle option. The mode selection determines the level of information displayed on the dashboard
Settlements Visualization
In this mode, the dashboard shows essential indicators and data for the selected site .
Region/Country Visualization
In this mode, the dashboard shows essential indicators and data for the selected Location .
SSAT Shelter Dashboard
The SSAT Shelter Dashboard is a predefined dashboard that provides key indicators related to settlement . This section will walk you through the different indicators, graphs, and filters available on the dashboard.
Accessing the dashboard
What : Access The SSAT Shelter Dashboard
Who : All users, including anonymous users, can access the dashboard.
How :
- Go to https://tims.unhcr.org/ in your web browser.
- If you are a registered user, sign in with your username and password as usual. For anonymous users, you can directly access the Dashboard Page without signing in.
- You'll be taken to the Home page after login.
-
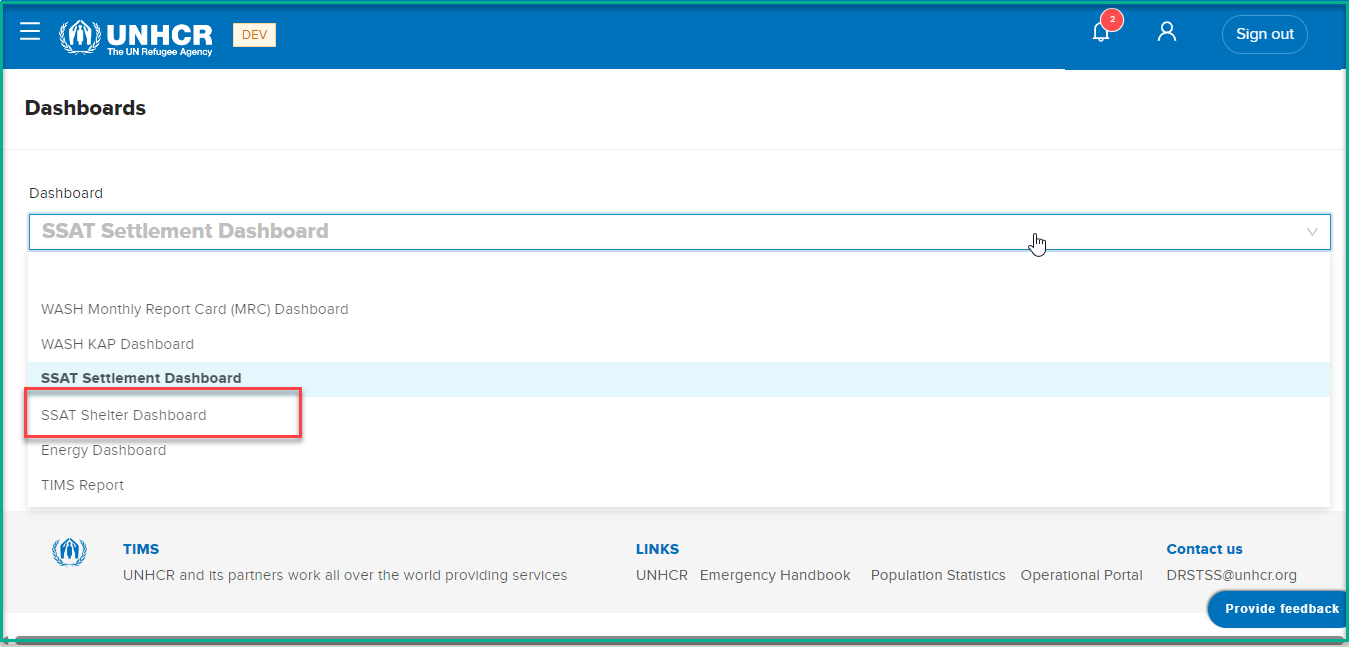
Open the Dashboard page
-
Click on the dashboard dropdown list then select 'SSAT Shelter Dashboard' option
-
After selecting 'SSAT Shelter Dashboard' , the system will initiate the data loading process, which may take a few minutes to complete, depending on the data volume.
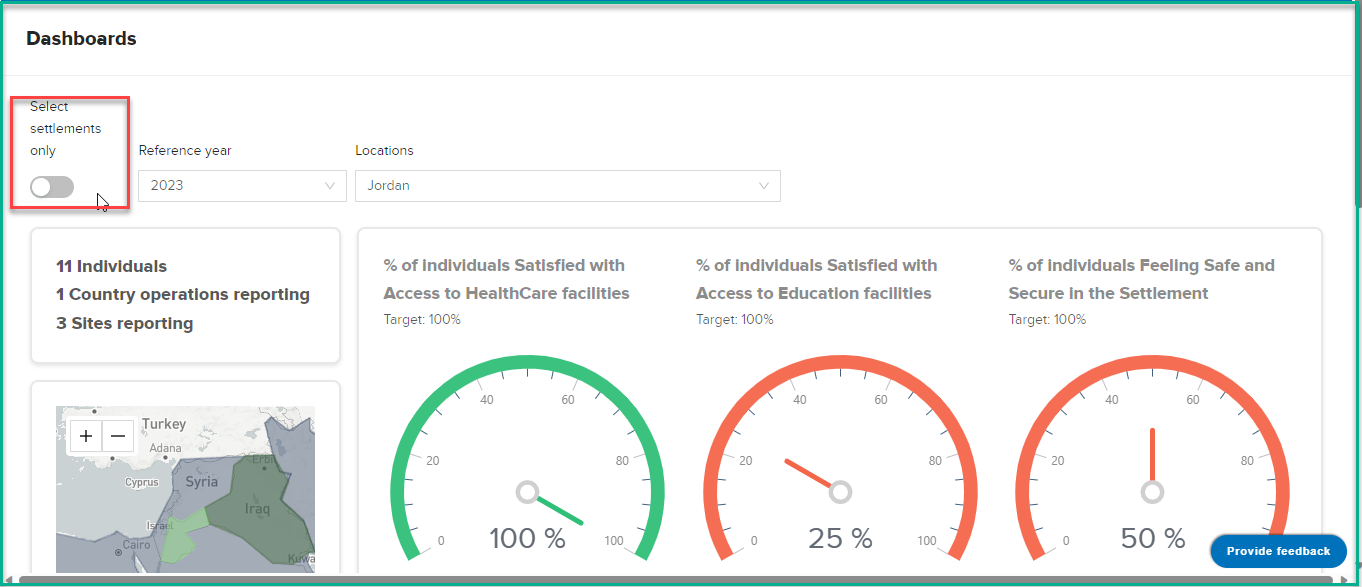
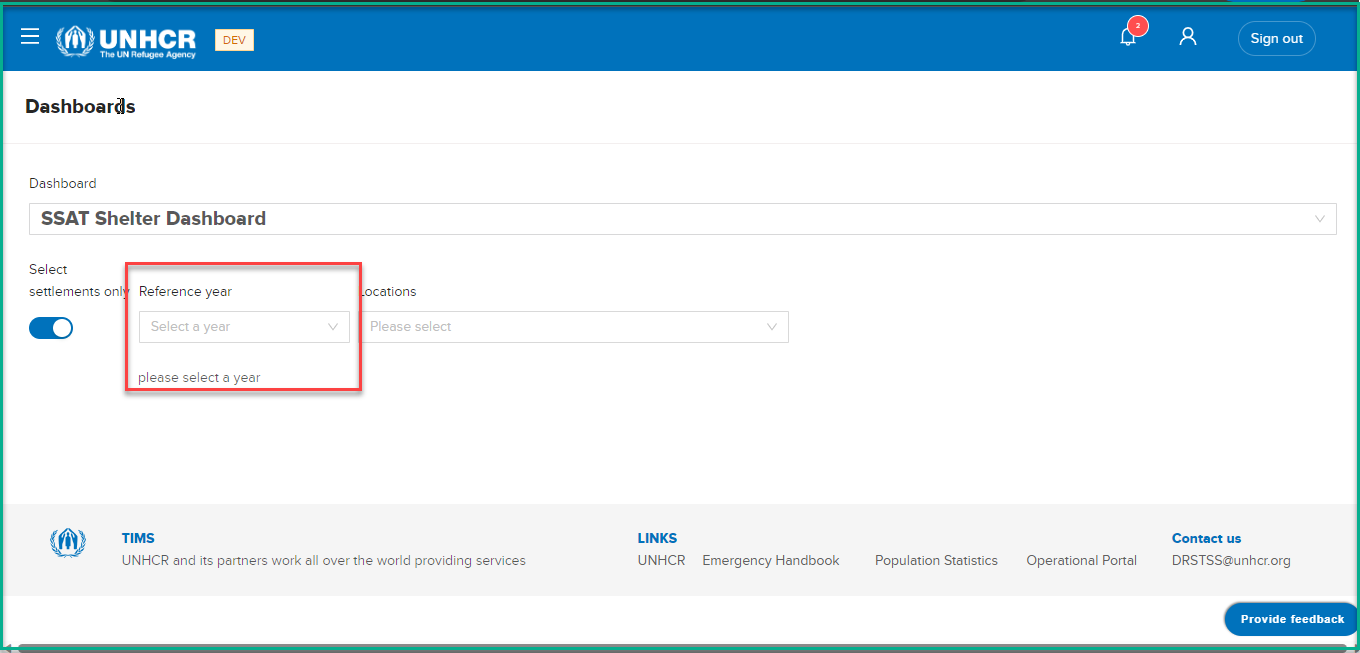
Dashboard Filters
The dashboard provides several pre-defined filters to help users focus on specific data subsets.
What : The dashboard provides two main options for filtering the data to customize the analysis according to specific requirements.
How :
- Selecting Settlements: Users can use the first filter option to choose specific locations they want to analyze.
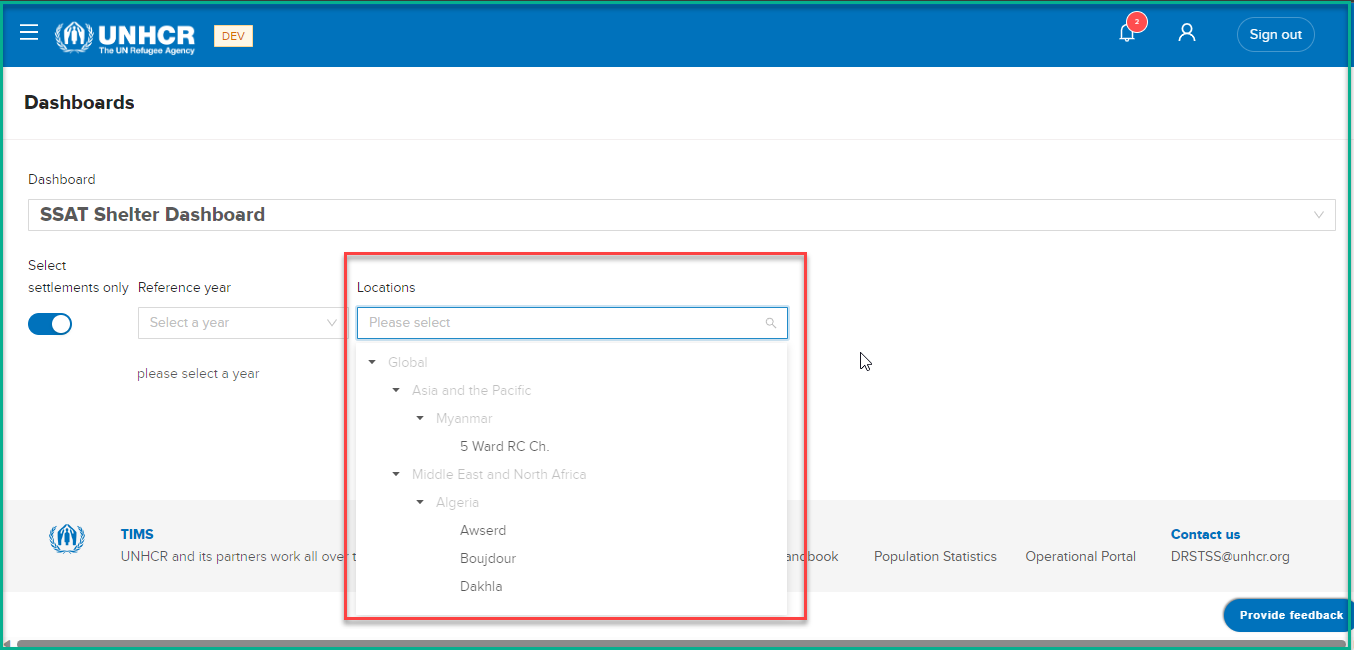
- Selecting Year: The second filter option allows users to define the year for their analysis.
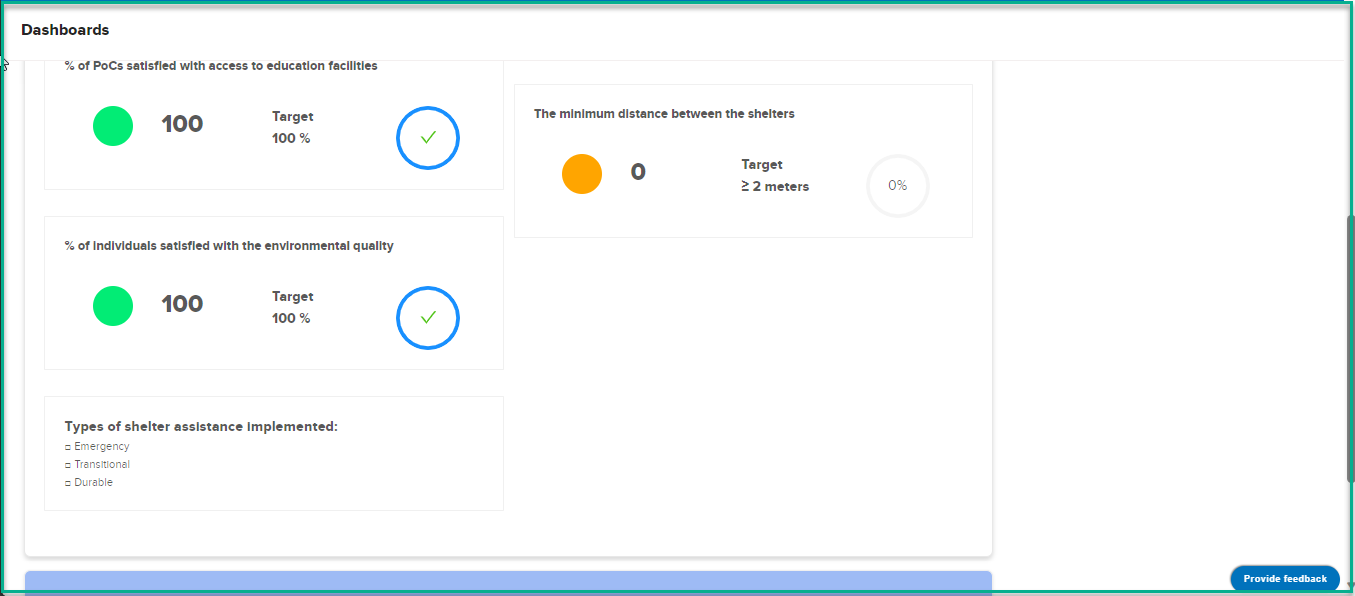
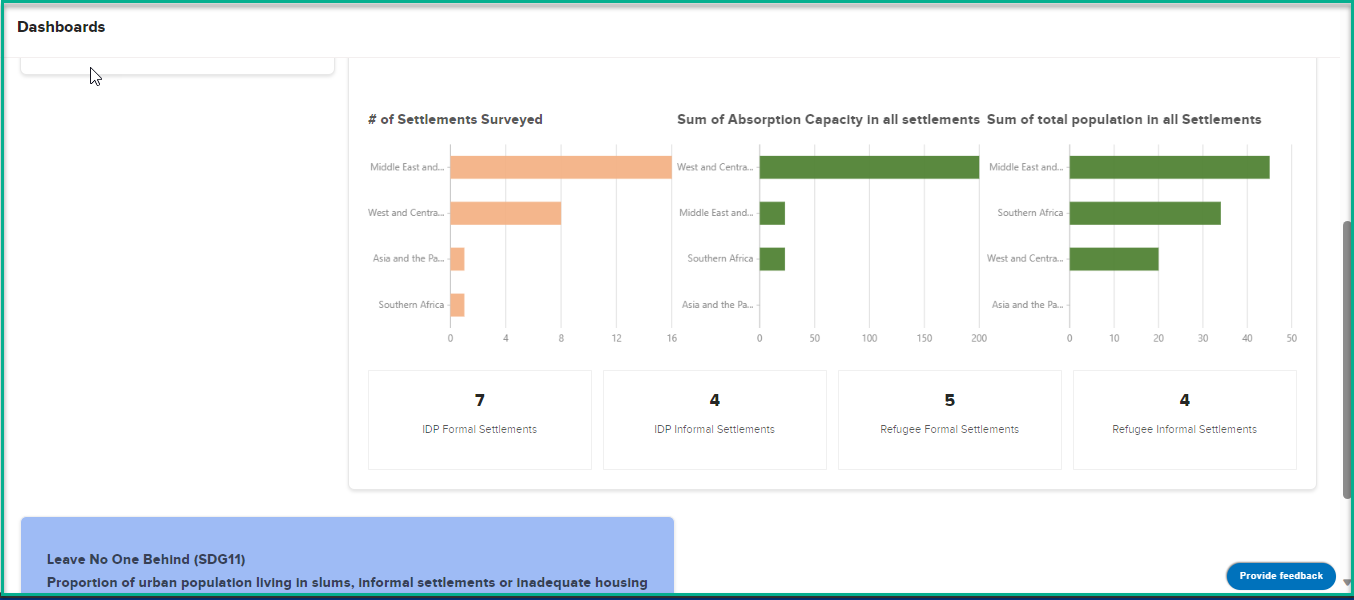
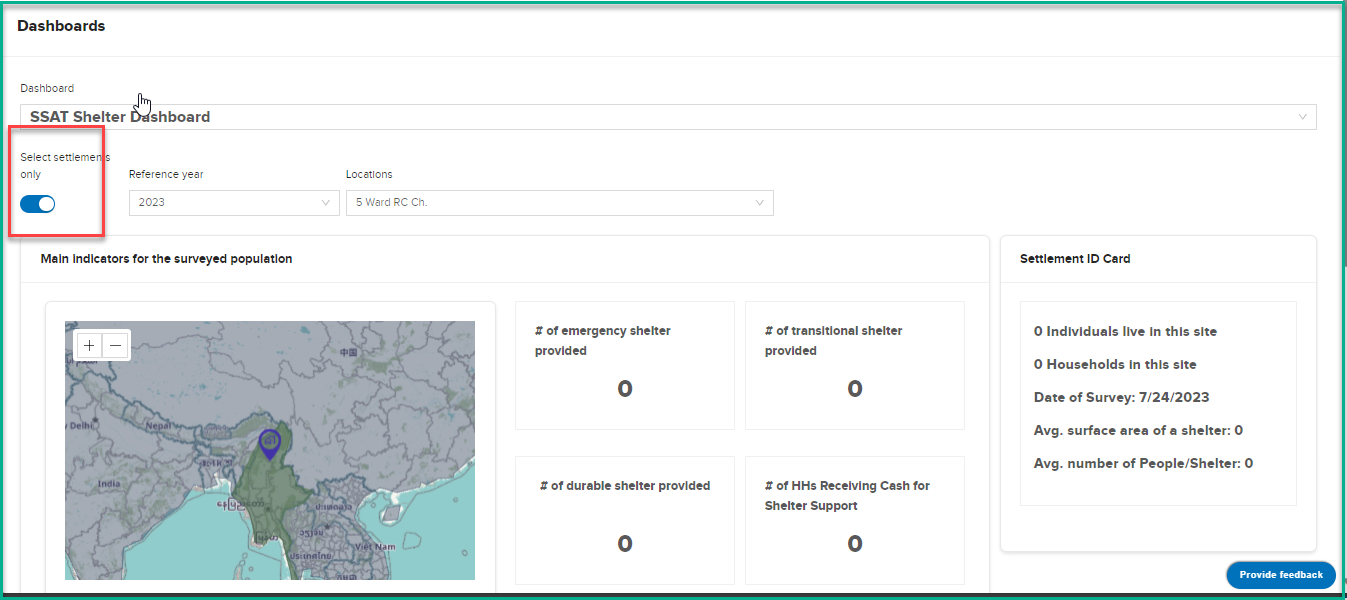
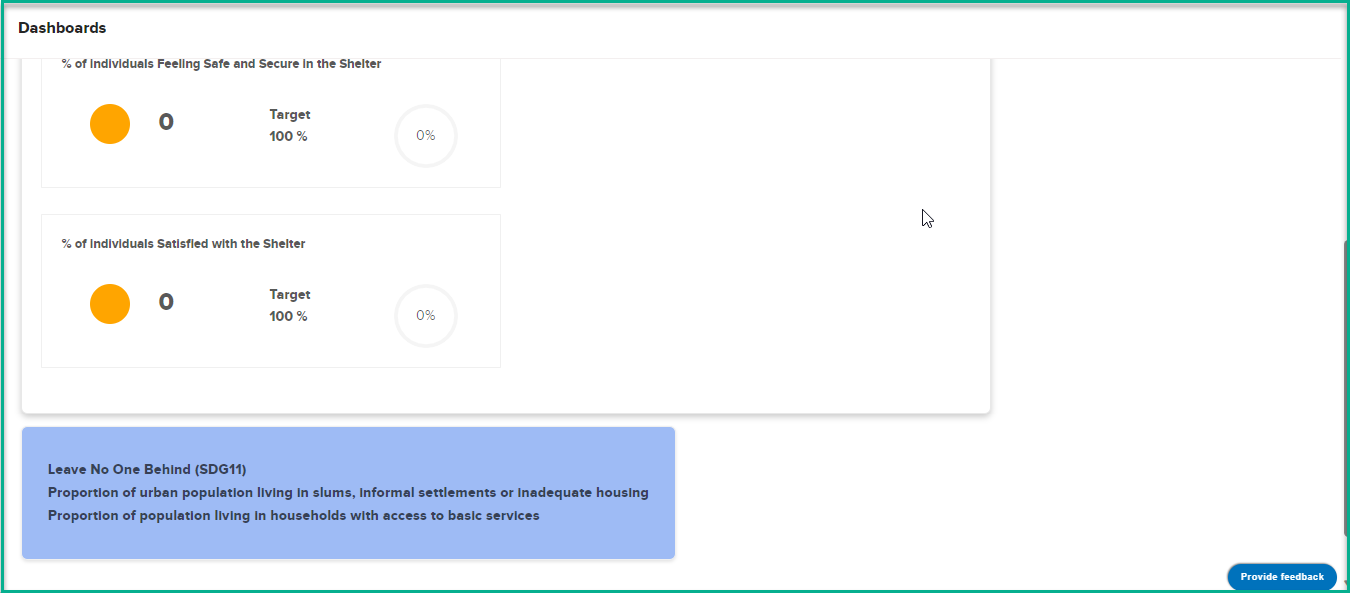
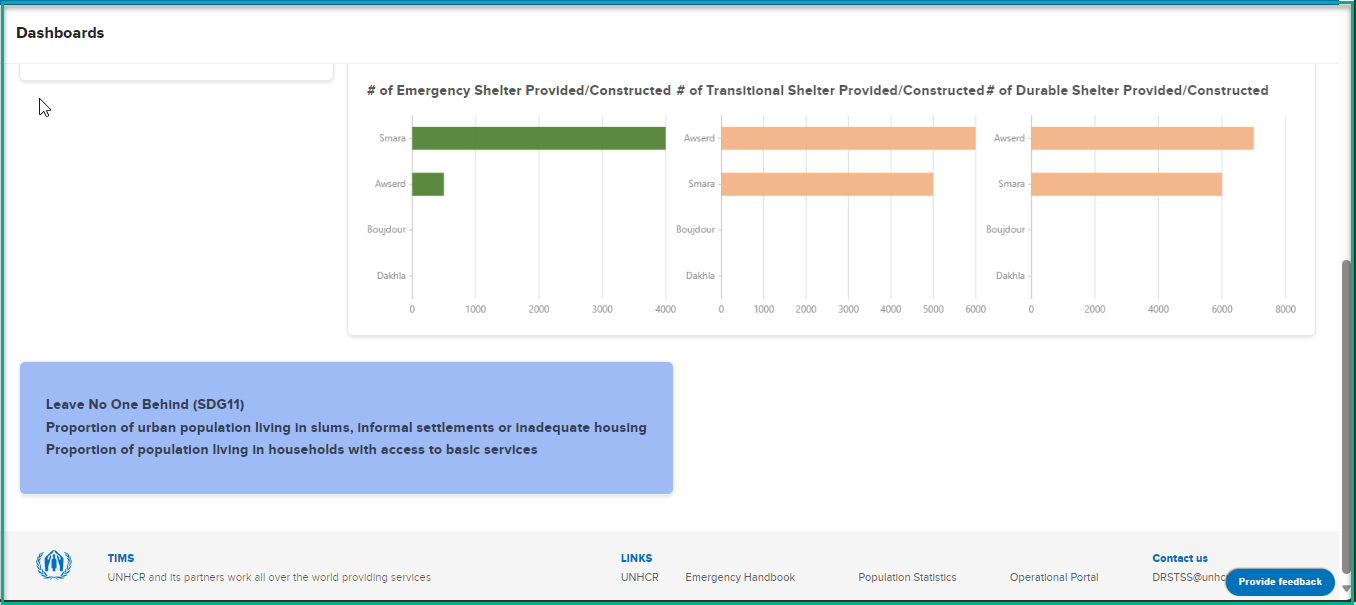
Dashboard Visualization
The dashboard provides two main modes of presentation, which can be controlled by the "settlements" toggle option. The mode selection determines the level of information displayed on the dashboard
Settlements Visualization
In this mode, the dashboard shows essential indicators and data for the selected site .
Region/Country Visualization
In this mode, the dashboard shows essential indicators and data for the selected Location .
Energy Dashboard
The Energy Dashboard is a predefined dashboard that provides key indicators related to settlement . This section will walk you through the different indicators, graphs, and filters available on the dashboard.
Accessing the dashboard
What : Access The Energy Dashboard
Who : All users, including anonymous users, can access the dashboard.
How :
- Go to https://tims.unhcr.org/ in your web browser.
- If you are a registered user, sign in with your username and password as usual. For anonymous users, you can directly access the Dashboard Page without signing in.
- You'll be taken to the Home page after login.
-
Open the Dashboard page
-
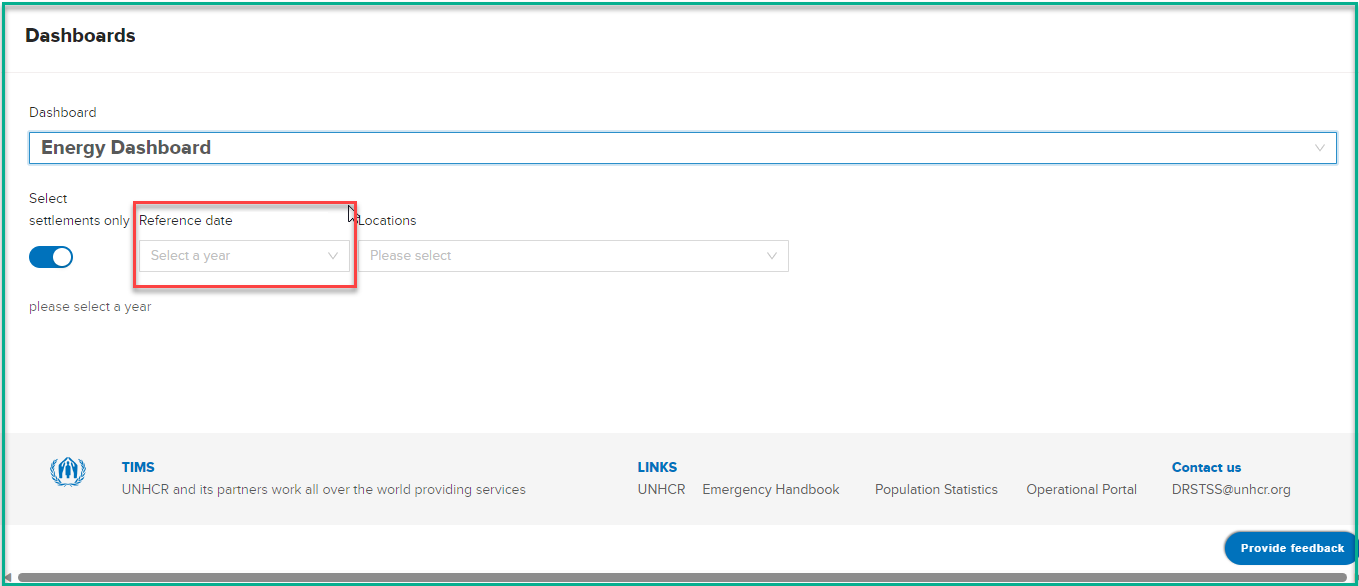
Click on the dashboard dropdown list then select 'Energy Dashboard' option
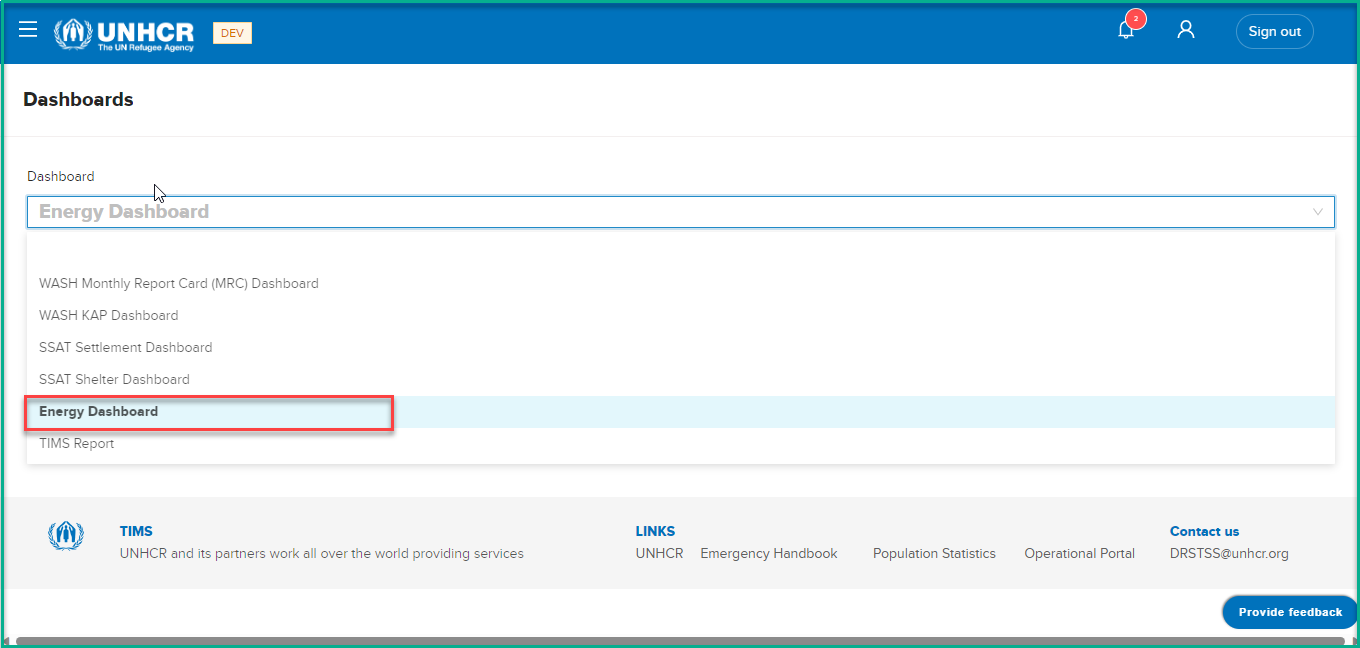
-
After selecting 'Energy Dashboard' , the system will initiate the data loading process, which may take a few minutes to complete, depending on the data volume.
Dashboard Filters
The dashboard provides several pre-defined filters to help users focus on specific data subsets.
What : The dashboard provides two main options for filtering the data to customize the analysis according to specific requirements.
How :
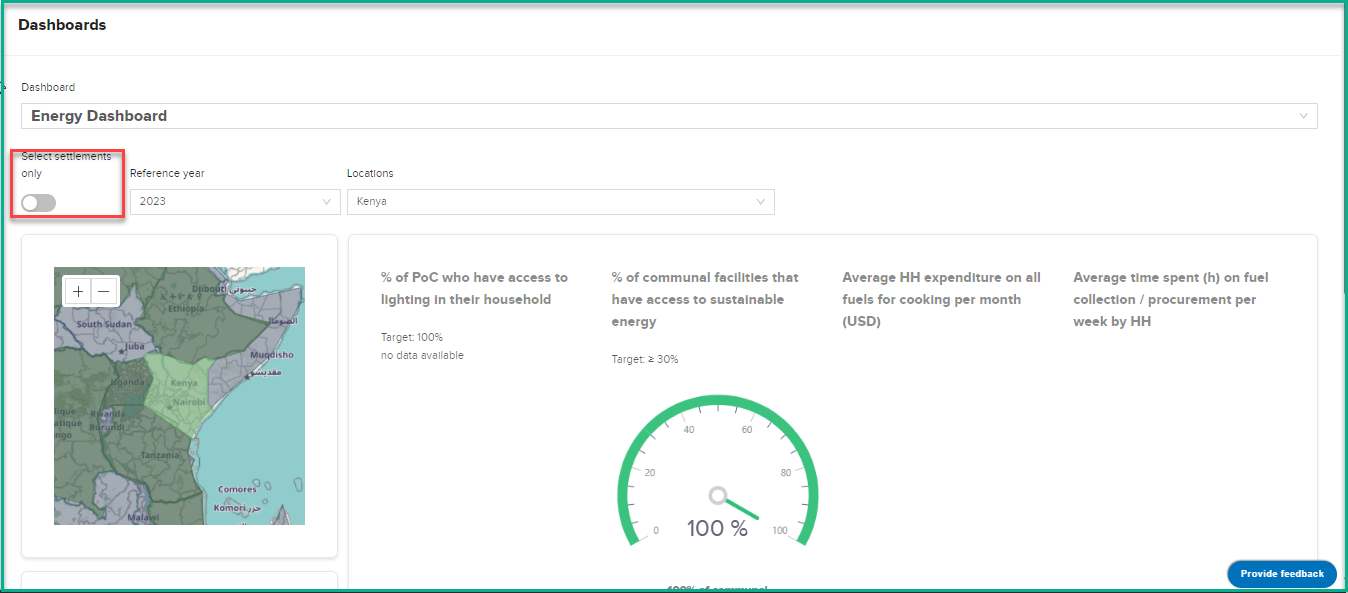
- Selecting Settlements: Users can use the first filter option to choose specific locations they want to analyze.
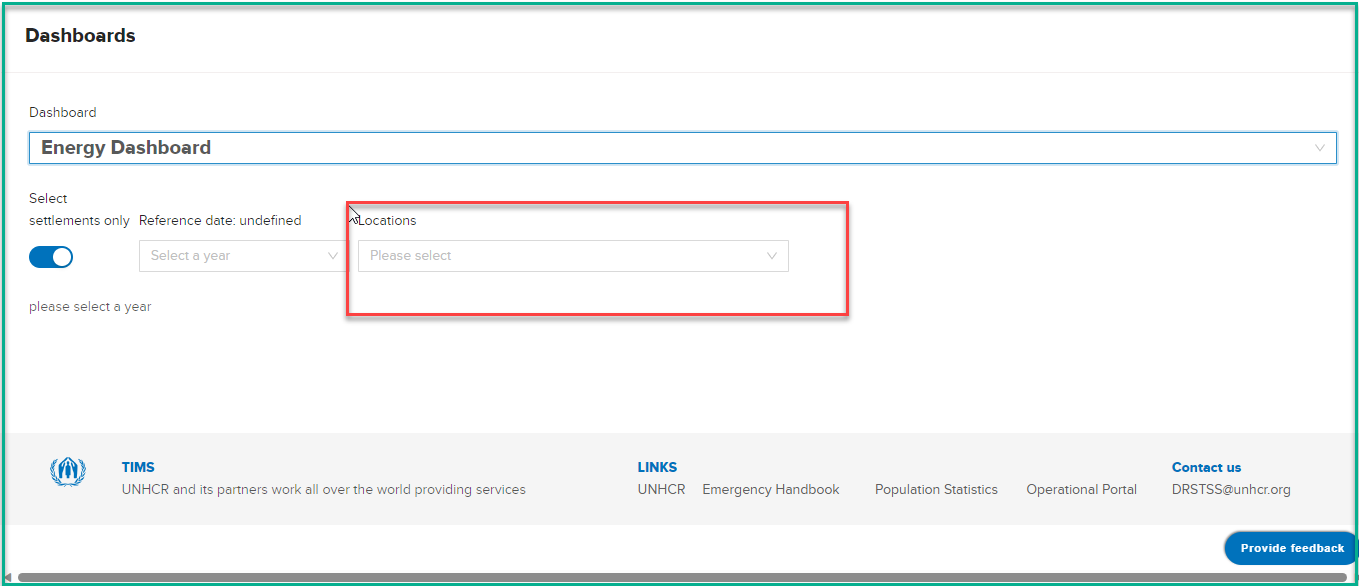
- Selecting Year: The second filter option allows users to define the year for their analysis.
Dashboard Visualization
The dashboard provides two main modes of presentation, which can be controlled by the "settlements" toggle option. The mode selection determines the level of information displayed on the dashboard
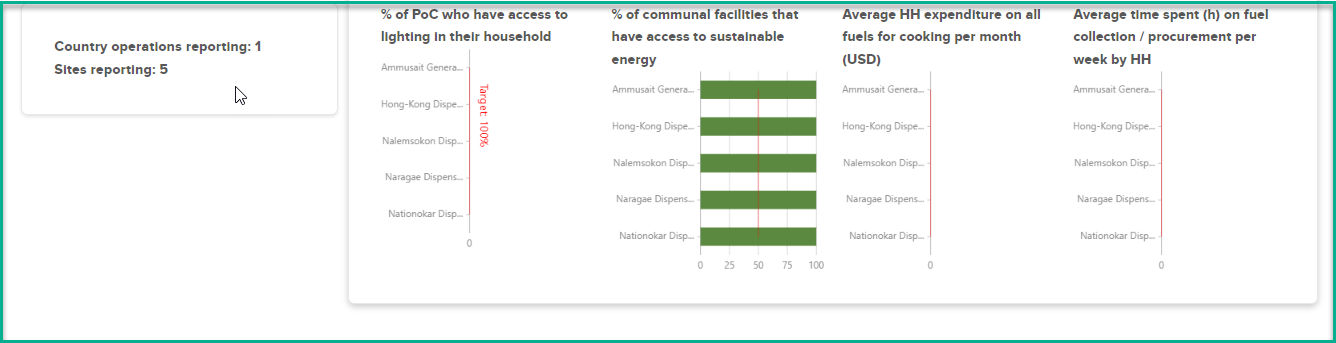
Settlements Visualization
In this mode, the dashboard shows essential indicators and data for the selected site .
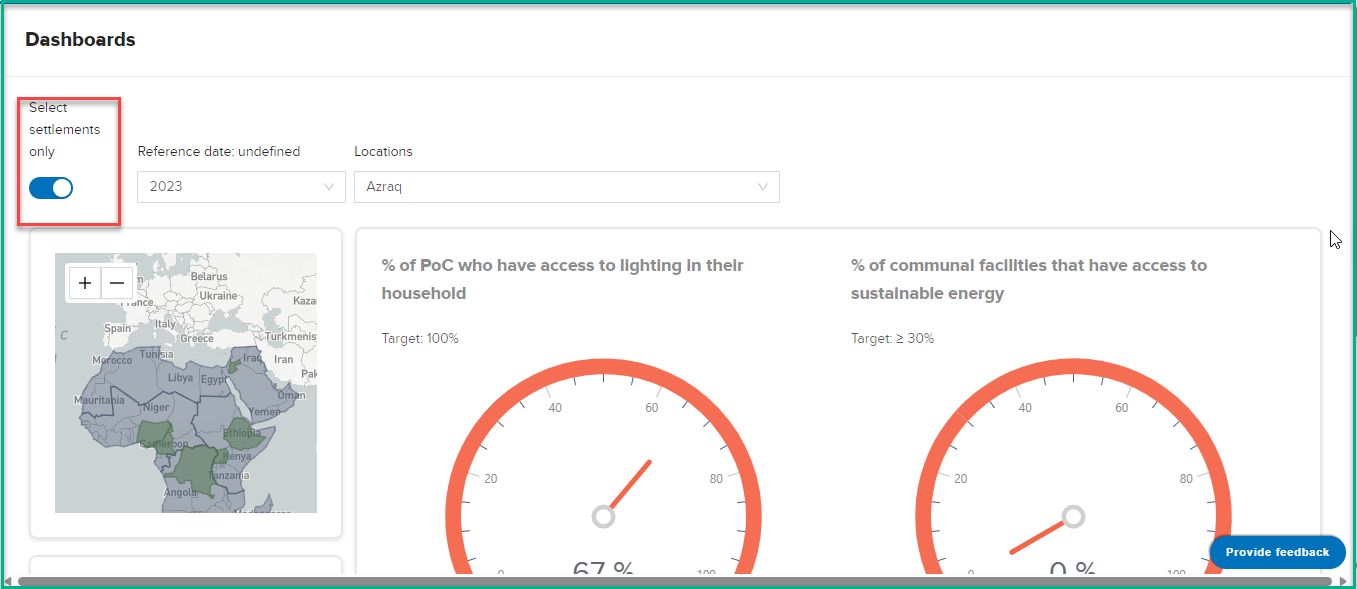
Region/Country Visualization
In this mode, the dashboard shows essential indicators and data for the selected Location .